

Patient acquisition cost (PAC) is the total you spend on marketing and sales divided by the number of new patients you bring in: PAC = total marketing and sales costs ÷ new patients acquired. According to PatientPrism's 2026 benchmarks, the cross-specialty mean sits at roughly $370 per patient, with ranges running from about $155 for pediatrics up to $610 for cosmetic surgery. Those numbers tell you whether your spend is in the right zip code, but the ratio that actually governs decisions is LTV:PAC of at least 3:1, meaning your patient acquisition cost should stay at or below roughly one-third of a patient's lifetime value to the practice.
- Formula: PAC = total marketing + sales costs ÷ new patients acquired (use "appointment completed," not leads)
- 2026 cross-specialty mean: ~$370 (PatientPrism)
- Specialty range: ~$155 (pediatrics) to ~$610 (cosmetic surgery)
- Target ratio: LTV:PAC ≥ 3:1 for sustainable unit economics
$370 is the 2026 cross-specialty average PAC. Practices that push inquiry-to-appointment conversion toward 85% can cut their effective PAC by 19–27% without changing ad spend.
Key Takeaways
Practices that measure PAC correctly, fix conversion first, and track LTV:PAC as the governing ratio consistently outperform those that optimize ad spend alone.
| Point | Details |
|---|---|
| Calculate PAC correctly | Use appointment completed as the denominator and include all six cost categories in the numerator. |
| Target LTV:PAC ≥ 3:1 | Your PAC should stay at or below one-third of patient lifetime value; specialty practices with higher LTVs can sustain higher absolute PAC. |
| Fix conversion before media | Pushing inquiry-to-appointment conversion toward 85% can reduce effective PAC by 19–27% with no change in ad spend. |
| Run a 90-day sprint | Baseline in weeks 1–2, experiment in weeks 3–6, scale validated channels in weeks 7–12, and measure on a rolling 90-day window. |
| Zensweb for performance-based growth | Zensweb's patient acquisition program ties fees to booked appointments, not retainer hours, with a free audit to start. |
Table of Contents
- Why patient acquisition cost is a practice's most important unit-economics metric
- How to calculate your PAC: step-by-step with a worked example
- U.S. PAC benchmarks by specialty: 2026 snapshot
- What PAC looks like by marketing channel
- What to include in your PAC numerator
- 7 prioritized tactics to reduce patient acquisition cost
- Your 90-day PAC reduction roadmap
- How to measure PAC accurately: attribution, KPIs, and tools
- How benchmark reports compile PAC figures, and why that matters
- The PAC metric most practices are measuring wrong
- Zensweb's performance-based approach to lowering your PAC
- Sources
Why patient acquisition cost is a practice's most important unit-economics metric
PAC measures the efficiency of your entire new-patient funnel, from the first ad impression or referral call through to a completed appointment. It captures paid media, agency fees, staff time, and marketing technology, but it deliberately excludes downstream clinical revenue from the numerator. That separation keeps the metric honest: you're measuring what you spent to get a patient in the door, not what they generated once they arrived.
The metric's real power shows up when you set it against lifetime value. A primary care practice with a patient LTV of $900 needs to keep PAC below $300 to hit a 3:1 ratio. A dermatology practice with an LTV of $2,400 can sustain a PAC of $800 and still be well inside the same ratio. Medical Economics recommends targeting at least 3:1 as the floor for sustainable unit economics, and specialty practices with higher LTVs have more room to invest aggressively in acquisition before the math turns against them.
What PAC does not capture is equally worth knowing:
- Patient quality: a low PAC from a channel that sends one-visit patients may be worse than a higher PAC from a channel that sends long-term, high-LTV patients.
- No-show and cancellation rates: these inflate your effective PAC if you count scheduled appointments rather than completed ones.
- Retention and referral value: a patient who refers three others has a multiplied LTV that makes the original PAC look even better.
Pro Tip: Track PAC separately for each service line. A practice running both primary care and a cash-pay aesthetics program will see wildly different LTV:PAC ratios, and blending them hides which line is actually profitable to grow.
Growth-stage practices often accept a PAC above the 3:1 floor temporarily while building brand recognition and referral networks. Steady-state practices should hold the line at 3:1 or better and treat any drift above it as a signal to audit conversion, not just spend more.
How to calculate your PAC: step-by-step with a worked example
Getting the formula right matters less than getting the inputs right. Most practices undercount costs and overcount patients, which produces a PAC that looks flattering but misleads every budget decision downstream.
Step 1: Define your time period. Use a rolling 90-day window for operational decisions and quarterly aggregation for executive reporting. A GetPracticeHelp playbook recommends this cadence specifically to smooth short-term volatility without losing the signal you need for monthly optimization.
Step 2: Sum all acquisition costs. Include every dollar that exists to bring in new patients (see Section 6 for the full line-item list). Exclude costs that serve existing patients only, such as recall campaigns or chronic-care management.
Step 3: Count new patients correctly. Use "appointment completed" as your denominator, not leads, not scheduled appointments. Improvado's PAC guide recommends this definition specifically because it accounts for no-shows and cancellations that inflate your count if you stop at "scheduled."
Step 4: Divide. PAC = Step 2 total ÷ Step 3 count.
Step 5: Segment by channel. A blended PAC is useful for executive reporting. Channel-level PAC is what you actually optimize.
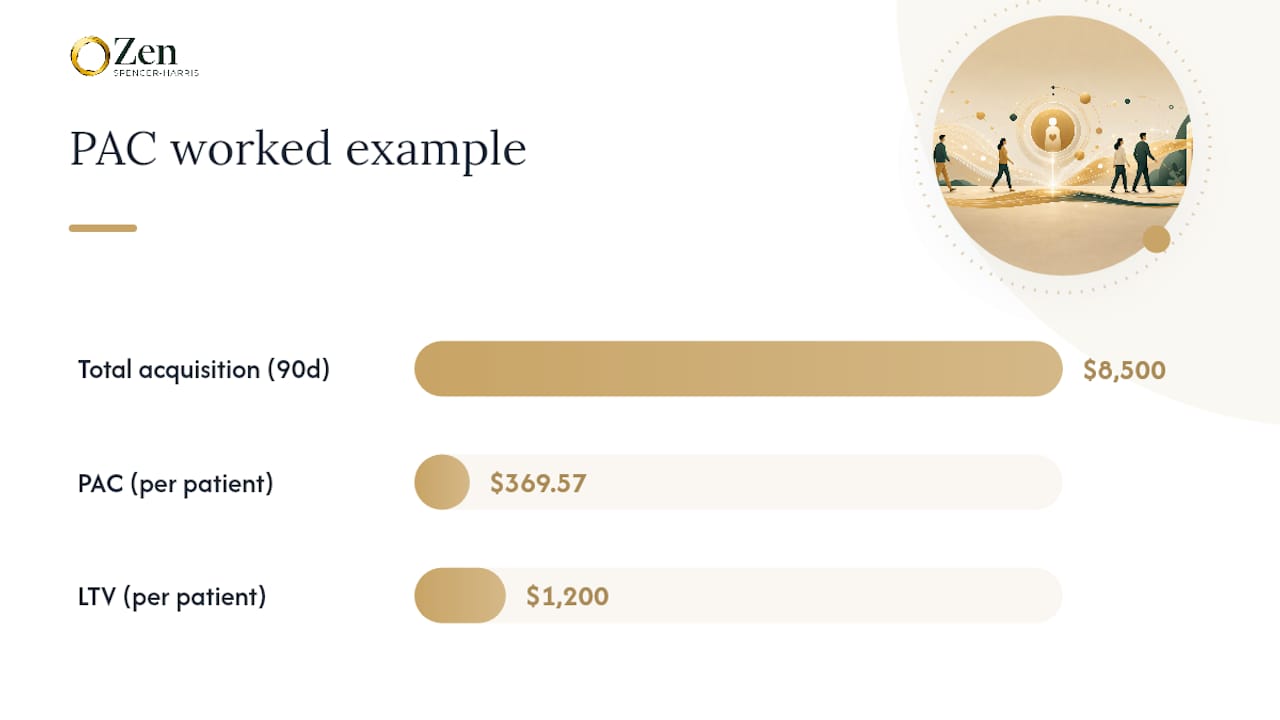
Worked example:
New patients (appointment completed, same period): 23
PAC = $8,500 ÷ 23 = $369.57
That lands almost exactly on the 2026 cross-specialty mean, which is a useful sanity check. If your LTV is $1,200, your LTV:PAC ratio is 3.25:1, just above the 3:1 floor.
Pro Tip: When a staff member splits time between patient care and marketing (a common scenario for physician liaisons), allocate their cost by percentage of time spent on acquisition activities. Document the split quarterly so your PAC doesn't drift as roles evolve.
Common exclusions that trip up the calculation:
- Recall and reactivation campaigns (serve existing patients, not new ones)
- Patient education materials used post-visit
- EHR and billing software (operational, not acquisition-focused)
- Costs tied to insurance contract negotiations
U.S. PAC benchmarks by specialty: 2026 snapshot
Specialty-level benchmarks are where PAC gets genuinely useful. A $370 blended average tells you little if you're running a cardiology practice competing in a high-cost urban market. The ranges below come from PatientPrism's 2026 benchmark data and reflect U.S. practices across multiple regions.
Variance matters as much as the average. A dermatology practice in Manhattan will see PAC closer to cosmetic surgery ranges than to the national dermatology mean. Local advertising costs, competition density, and your practice's LTV all shift where your benchmark should sit.
Three factors drive most of the variance within a specialty:
- LTV: Higher-LTV specialties can sustain higher PAC and still clear 3:1. Cosmetic surgery's $610 average looks expensive until you factor in a typical LTV of $3,000 or more.
- Competition density: Urban markets with multiple competing practices on the same Google search page push paid-channel PAC up significantly.
- Conversion rate: The same ad spend produces a PAC of $370 at 60% conversion and closer to $290 at 85% conversion. That gap is the conversion opportunity PatientPrism's analysis quantifies at 19–27%.
When choosing a benchmark, match on specialty first, then geography, then practice size. A solo-provider practice should not benchmark against a 10-provider group even within the same specialty.
What PAC looks like by marketing channel
Channel-level PAC is where you find the levers. The blended number tells you whether you have a problem; the channel breakdown tells you where it lives.
GetPracticeHelp's channel tables and PatientPrism's data consistently show the same hierarchy: referral and organic channels carry the lowest PAC, paid search delivers high-intent volume at a higher cost, and paid social sits in the middle with lower conversion rates.
Typical channel PAC ranges for U.S. specialty practices:
- Patient referrals: $20–$80 per acquired patient (mostly staff time and referral program costs)
- Organic SEO / Google Business Profile: $50–$150 (content and technical SEO amortized over volume)
- Online directories and review sites: $80–$200 (listing fees, reputation management time)
- Google Search Ads: $200–$500+ (high intent, but cost-per-click in healthcare is among the highest of any industry)
- Paid social (Meta, Instagram): $150–$400 (lower intent than search; conversion rates typically lower)
- Physician liaison / B2B referral programs: $100–$350 (salary allocation plus events; high LTV patients)
The channel-priority checklist for lowering blended PAC:
- Max out referral programs before adding paid spend.
- Build organic visibility (SEO, Google Business Profile, review volume) as a long-term PAC floor.
- Use Google Search Ads for high-intent, high-LTV service lines where the math clears 3:1.
- Test paid social for awareness and retargeting, not as a primary acquisition channel.
- Audit directory listings quarterly; they often deliver low-PAC patients that go unattributed.
Pro Tip: Attribution is where channel PAC breaks down. Most practices run last-touch attribution, which credits Google Ads for patients who actually found the practice through a referral and then Googled the name. Use call-tracking software like CallRail or WhatConverts to capture the actual first-touch source, especially for phone-heavy specialties like cardiology and behavioral health.
What to include in your PAC numerator
Getting the denominator right (appointment completed, not leads) is step one. Getting the numerator right is where most practices leave money on the table, either by undercounting costs and thinking their PAC is better than it is, or by overcounting and pulling back spend that's actually working.
Improvado's cost-category guidance identifies six core categories. Here's the full line-item checklist:
Paid media and advertising:
- Google Search Ads, display, and Performance Max
- Meta and Instagram ads
- Programmatic display and retargeting
- Sponsored listings on Healthgrades, Zocdoc, Vitals, and similar directories
Agency and vendor fees:
- SEO agency or consultant retainer
- Paid media management fees
- PR and content agency fees
- Reputation management service fees
Internal team costs (acquisition-focused time only):
- Marketing coordinator or manager salary and benefits, prorated by percentage of time on acquisition
- Physician liaison salary and benefits, prorated for new-patient outreach activities
- Front-desk staff time spent on new-patient inquiry calls (often overlooked)
Marketing technology:
- Call-tracking software
- CRM and patient relationship management tools
- Marketing automation platform fees
- Analytics and attribution tools
Content and creative production:
- Website copy, landing pages, and blog content
- Video production for paid ads or organic channels
- Graphic design for ads and print materials
Events and offline media:
- Community health events and sponsorships
- Print advertising, direct mail, and outdoor
- Referral partner dinners and physician outreach events
Allocation rule for shared staff: document the percentage of time each person spends on new-patient acquisition versus existing-patient care or administrative tasks. Review the split quarterly.
Downstream clinical revenue stays out of the numerator entirely. Including it conflates acquisition efficiency with clinical productivity and makes the metric uninterpretable for marketing decisions.
7 prioritized tactics to reduce patient acquisition cost
The fastest PAC reductions almost never come from cutting ad spend or switching channels. They come from fixing what happens after an inquiry arrives. HealthcareDive's guide to reducing PAC and Medical Economics both point to conversion and booking speed as the highest-leverage levers, and the PatientPrism data backs that up: a 19–27% effective PAC reduction is available to practices that push conversion toward 85%, with no change in ad spend.
-
Fix call handling and booking speed first. A new-patient inquiry that goes to voicemail or waits more than 24 hours for a callback converts at a fraction of the rate of one answered live. Audit your call answer rate before touching your media budget.
-
Install call tracking and follow-up automation. You cannot optimize what you cannot measure. Call-tracking software captures source, records calls for quality review, and triggers automated follow-up sequences for missed calls. This single change often surfaces a 20–30% conversion gap that was invisible before.
-
Tighten your paid search funnel. Negative keyword hygiene, match-type discipline, and landing pages that match ad intent can cut cost-per-inquiry by 20–40% without reducing volume. Most Google Ads accounts in healthcare are running broad match on terms that attract unqualified clicks.
-
Shift budget toward referral and organic channels. Referral PAC runs $20–$80 versus $200–$500 for paid search. Every dollar you move from paid to a referral program or SEO investment lowers your blended PAC over time. The tradeoff is time: referral and organic channels build slowly, so this is a 6–12 month play, not a 30-day fix.
-
Optimize your Google Business Profile and review volume. Practices with 50+ Google reviews and a 4.5+ rating convert directory and map-pack visitors at meaningfully higher rates. Healthcare reputation management is one of the lowest-cost PAC levers available, and most practices underinvest in it.
-
Reduce no-shows through confirmation and reminder sequences. No-shows inflate effective PAC because you paid to acquire a patient who didn't complete an appointment. Automated SMS and email reminders with easy rescheduling options typically cut no-show rates by a measurable margin, which directly improves your PAC denominator.
-
Move to performance-based vendor contracts. Agencies paid on retainer have no financial incentive to improve your PAC. Contracts tied to booked appointments or cost-per-acquisition targets align vendor incentives with yours and create accountability for the metrics that matter.
Pro Tip: Tackle tactics 1 and 2 before spending another dollar on media. That's a faster return than any channel reallocation.
Your 90-day PAC reduction roadmap
A 90-day sprint works because it's long enough to see real signal from optimization experiments but short enough to maintain urgency. GetPracticeHelp's playbook recommends a rolling 90-day measurement window for exactly this reason. Here's how to structure it, with the KPIs to watch at each stage. You can also use this framework when onboarding a performance partner for a 90-day growth sprint.
-
Weeks 1–2: Baseline and quick wins
- Calculate your current blended PAC using the formula and cost categories above.
- Install call tracking if not already in place; tag all paid campaigns with UTM parameters.
- Audit call answer rate and average response time for new-patient inquiries.
- Set up a simple dashboard tracking: daily inquiries, scheduled appointments, completed appointments, and spend by channel.
- Quick win: update Google Business Profile, request reviews from recent patients, and verify all directory listings are accurate.
-
Weeks 3–6: Conversion experiments
- A/B test front-desk scripts for new-patient calls; measure conversion rate before and after.
- Launch or tighten a missed-call follow-up sequence (SMS within 5 minutes, email within 1 hour).
- Run a negative keyword audit on all paid search campaigns; pause broad match terms with high spend and low conversion.
- Test one landing page variant per paid campaign; measure inquiry-to-appointment rate, not just click-through rate.
- KPIs to watch weekly: inquiry volume by channel, inquiry-to-scheduled rate, scheduled-to-completed rate, PAC by channel.
- Weeks 7–12: Scale what's working
- Double down on the channel and conversion combination that produced the lowest PAC in weeks 3–6.
- Launch or expand a structured patient referral program with a clear ask and simple mechanics.
- Begin a content or SEO investment in your highest-LTV service line (results will compound over 6–12 months).
- Review LTV:PAC ratio monthly; if it's above 3:1 and trending up, consider increasing acquisition spend.
- KPIs to watch monthly: blended PAC, PAC by channel, LTV:PAC ratio, no-show rate, new patient volume.
Pro Tip: If you're working with a performance-based vendor, set a minimum sample size before drawing conclusions from any experiment. Fewer than 30 completed appointments per channel per period produces noisy PAC numbers that will mislead optimization decisions. Wait for the signal before scaling or cutting.
How to measure PAC accurately: attribution, KPIs, and tools
Accurate PAC measurement requires three things working together: a clean cost numerator, a correctly defined patient denominator, and attribution that connects spend to completed appointments by channel. Most practices have one of the three. Few have all three.
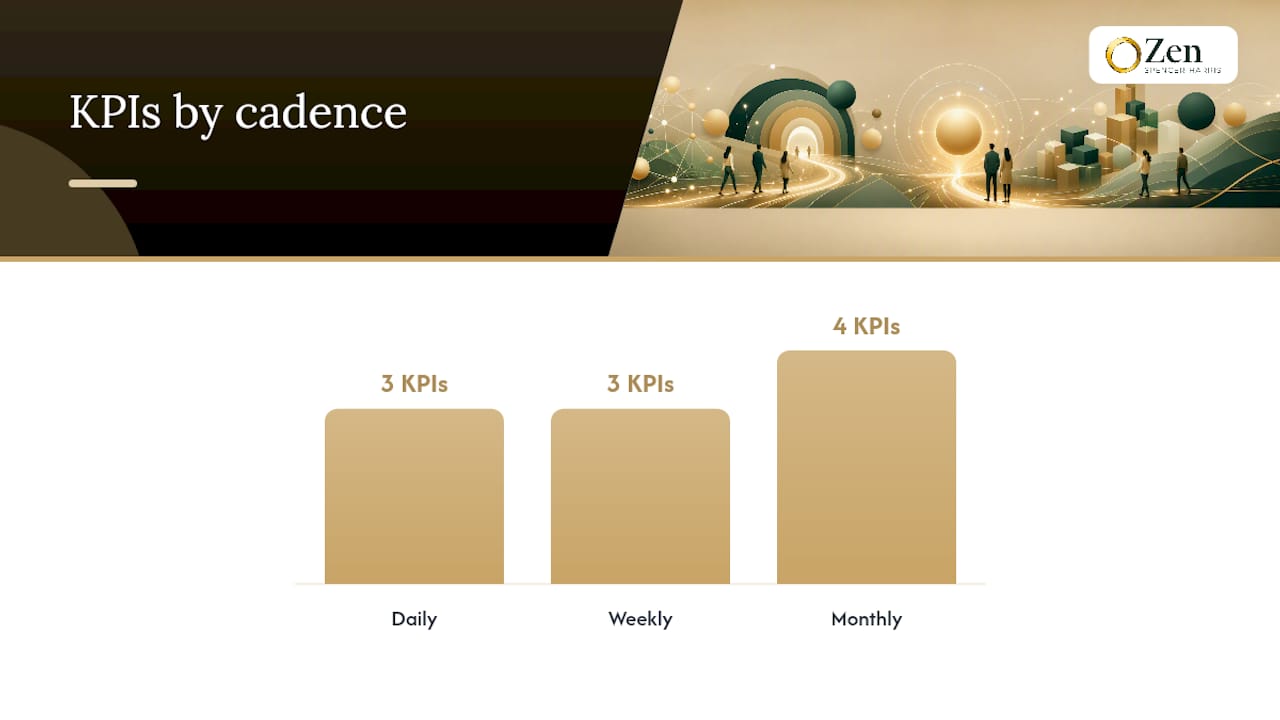
KPIs to track at each level:
- Daily: new-patient inquiry volume, call answer rate, missed-call follow-up rate
- Weekly: inquiry-to-scheduled conversion rate, scheduled-to-completed rate, PAC by channel (rolling)
- Monthly: blended PAC, LTV:PAC ratio, no-show-adjusted PAC, new patient volume by service line
Attribution model guidance:
Last-touch attribution is the default in most analytics platforms and the most misleading model for healthcare. A patient who saw a Facebook ad, read a blog post, checked Google reviews, and then called from a Google Search Ad will be credited entirely to paid search under last-touch. Multi-touch attribution distributes credit across the patient's journey and gives a more accurate picture of which channels are actually driving decisions. For practices with high phone inquiry volume, inquiry-level attribution (tracking the actual first-touch source of each call) is the most accurate model available.
BrighterClick's analysis makes the case clearly: counting leads instead of scheduled or completed patients is the single most common source of PAC mismeasurement, and it systematically overstates the efficiency of top-of-funnel channels.
Recommended tools for U.S. practices:
- Call tracking: CallRail or WhatConverts (both integrate with Google Ads and most CRMs; see the CallRail vs. WhatConverts comparison for healthcare-specific guidance)
- CRM: a practice management system with new-patient source tagging, or a standalone CRM like HubSpot with custom fields for acquisition source
- Analytics: Google Analytics 4 with goal tracking tied to appointment request form submissions
- Reporting: a simple spreadsheet or a BI tool pulling from the above; the PAC formula doesn't require expensive software, it requires clean inputs
Minimum data requirements before you can trust your PAC number: at least 90 days of cost data, at least 30 completed new-patient appointments per channel, and a consistent definition of "new patient" applied across all data sources.
How benchmark reports compile PAC figures, and why that matters
Not all PAC benchmarks are built the same, and using the wrong one as your target is a real risk. Before you benchmark your practice against any published figure, understand what that figure actually measures.
Common methodology differences to watch for:
- Nominal PAC vs. effective PAC: Nominal PAC uses scheduled appointments as the denominator. Effective PAC uses completed appointments. The difference can be 15–30% depending on your no-show rate. Always confirm which definition a benchmark uses before comparing.
- "New patient" definition: Some reports count any patient who called for the first time. Others count only patients who completed a first appointment. A benchmark built on the first definition will always show a lower PAC than one built on the second.
- Cost inclusion scope: Benchmarks that exclude internal staff costs or marketing technology will show lower PAC than those that include the full cost stack. The Improvado guide recommends including all six cost categories; many published benchmarks include only paid media spend.
- Sample size and regional representation: A benchmark built on 50 practices in the Southeast is not a reliable guide for a practice in the Pacific Northwest. Regional advertising costs, competition density, and payer mix all affect PAC.
Benchmark limitation: PatientPrism's 2026 figures are drawn from practices using their call-tracking platform, which skews toward practices already investing in conversion optimization. Their PAC figures may be lower than the true market average for practices without active conversion programs.
Practical guidance for selecting a benchmark:
- Match on specialty first, then geography, then practice size (solo vs. group).
- Prefer benchmarks that specify "appointment completed" as the denominator.
- Treat any benchmark as a directional range, not a precise target. A $50 variance from the benchmark is noise; a $200 variance is a signal worth investigating.
- When in doubt, build your own internal benchmark over 12 months and use published figures only for directional context.
The PAC metric most practices are measuring wrong
The practices that struggle most with PAC aren't the ones spending too much. They're the ones measuring the wrong thing and optimizing toward a number that doesn't reflect reality.
The most common version of this: a practice tracks "leads" as its acquisition metric, celebrates a low cost-per-lead from paid social, and never notices that those leads convert to completed appointments at half the rate of Google Search or referral traffic. The cost-per-lead looks great. The actual PAC, once you count only patients who showed up, is quietly terrible.
The second version is subtler. A practice measures PAC correctly but benchmarks it against a published figure that uses a different cost definition. Their PAC looks high. They cut the SEO budget. Six months later, organic inquiries drop and blended PAC rises, because they were actually running one of their most efficient channels and didn't know it.
What actually moves PAC fastest in real accounts is almost always a conversion fix, not a media reallocation. Booking speed, call answer rate, and front-desk script quality are operational variables that most marketing teams don't own and most practice managers don't measure. That's the gap. Fix the conversion rate first, then optimize the channel mix, then consider whether you're spending enough on the channels that are already working.
PAC is also not just marketing's problem. Scheduling policies, reminder sequences, and patient communication protocols are clinical operations decisions that directly affect the marketing metric. The practices that lower PAC fastest treat it as a business metric owned by the whole leadership team, not a number that lives in the marketing dashboard.
Zensweb's performance-based approach to lowering your PAC
Most marketing agencies charge a retainer whether or not your PAC improves. Zensweb's model runs the other direction: you pay for delivered results, specifically booked patient appointments and measurable visibility gains, not for activity.

Zensweb's patient acquisition services combine performance-based paid media, technical SEO, AI Share of Voice optimization (visibility on ChatGPT, Claude, Perplexity, and Google), and authority content, all tied to the same PAC reduction framework this article describes. The free Healthcare Vital Audit delivers a channel-level PAC snapshot and a prioritized 90-day plan specific to your specialty and market, so you know exactly where your acquisition cost is leaking before committing to any engagement. Results depend on practice-specific variables and agreed service-level terms; no outcome is guaranteed beyond the SLAs in your contract.
Sources
The benchmarks and frameworks in this article draw from the following primary sources. Each is worth consulting directly for raw data tables, calculators, and deeper methodology notes.
- Patient Acquisition Cost Guide for Healthcare Marketers
- Patient Acquisition Playbook for Medical Practices 2026 | GetPracticeHelp
- 8 tips to lower patient acquisition costs | Medical Economics
- How to reduce your patient acquisition costs
This article is general information, not a substitute for advice from a qualified financial advisor. Consult a qualified financial professional about your own circumstances before acting on anything here.